Hmm...blogger re-encodes my video and for some reason their version looks like crap, so I won't even leave it up. I think my new attempt has much better lighting, and the faces have translucent panes now. But here is a still shot:
Three sizes of the new version:
small (320x200)
medium (640x400)
large (1280x800).
Friday, July 24, 2009
Thursday, July 23, 2009
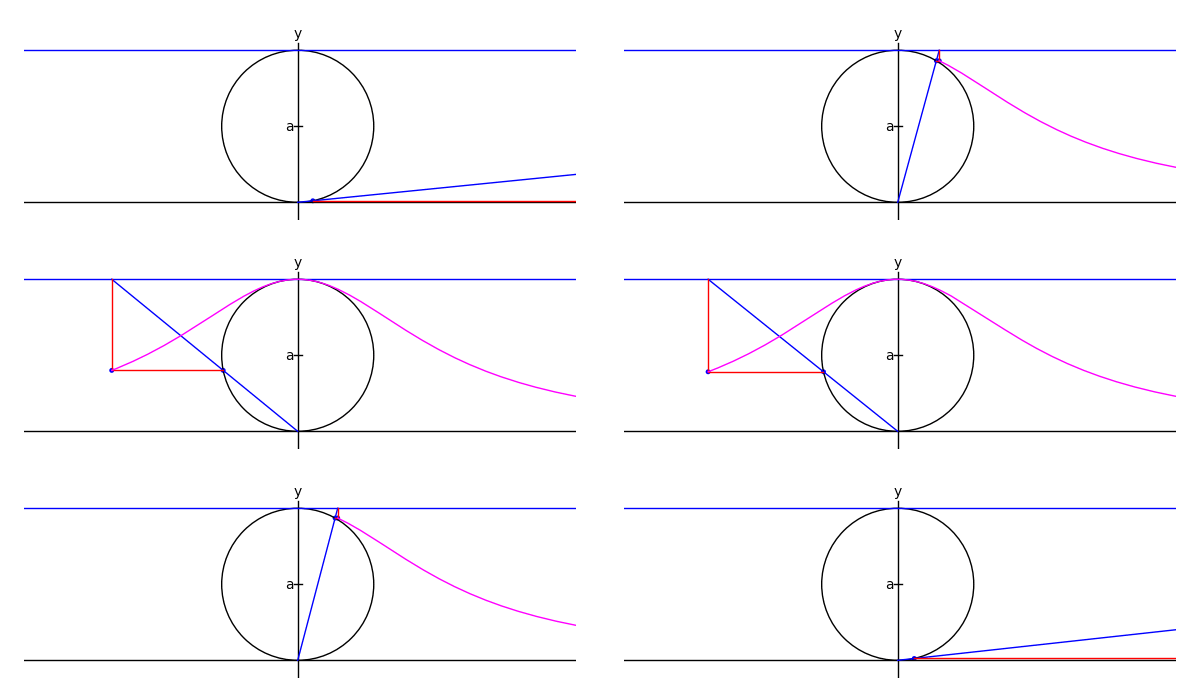
Witch of Maria Agnesi
There's one on wikipedia like this, but for an upcoming class I wanted to do it in Sage:
xtreme = 4.1
myaxes = line([[-xtreme,0],[xtreme,0]],rgbcolor = (0,0,0))
myaxes = myaxes + line([[0,-1],[0,2.1]],rgbcolor = (0,0,0))
a = 1.0
t = var('t')
npi = RDF(pi)
def agnesi(theta):
mac = circle((0,a),a,rgbcolor = (0,0,0))
maL = line([[-xtreme,2*a],[xtreme,2*a]])
maL2 = line([[0,0],[2*a*cot(theta),2*a]])
p1 = [2*a*cot(theta),2*a*sin(theta)^2]
p2 = [2*a*cot(theta)-cot(theta)*(2*a-2*a*sin(theta)^2),2*a*sin(theta)^2]
maL3 = line([p2,p1,[2*a*cot(theta),2*a]], rgbcolor = (1,0,0))
map1 = point(p1)
map2 = point(p2)
am = line([[-.05,a],[.05,a]], rgbcolor = (0,0,0))
at = text('a',[-.1,a], rgbcolor = (0,0,0))
yt = text('y',[0,2.2], rgbcolor = (0,0,0))
xt = text('x',[xtreme + .1,-.1], rgbcolor = (0,0,0))
#tt = text('t',[.15,.1], rgbcolor = (0,0,0))
matext = at+yt+xt
ma = mac+myaxes+maL+am+matext+maL2+map1+maL3+map2
return ma
def witchy(theta):
ma = agnesi(theta)
agplot = parametric_plot([2*a*cot(t),2*a*sin(t)^2],[t,.001,theta], rgbcolor = (1,0,1))
return ma+agplot
a2 = animate([witchy(i) for i in srange(.1,npi-.1,npi/60)]+[witchy(i) for i in srange(npi-.1,.1,-npi/60)], xmin = -3, xmax = 3, ymin = 0, ymax = 2.3, figsize = [6,2.3], axes = False)
a2.show()
Wednesday, July 15, 2009
24 cell movie
This is basically a test of my workflow for a more ambitious project, but its somewhat amusing in its own right. The original 48 MB version is here (much better quality).
Tuesday, July 7, 2009
Michael Corral's Calculus 3 book
Last year I became aware of the fantastic free calc 3 book by Michael Corral. His website for it is here. I wanted to be able to compile the latex source files myself but couldn't get it to work on my mac or windows machines. I just gave it another try and finally succeeded on OS X.
Besides using his calc3book.sh script, I found it necessary to:
1) install pgf/tigz.
2) put picins.sty in my tex directory
3) Put the metapost files from m3Dplain in my tex directory.
Its a beautifully done book, so I am excited to learn some of the tricks Corral uses.
Besides using his calc3book.sh script, I found it necessary to:
1) install pgf/tigz.
2) put picins.sty in my tex directory
3) Put the metapost files from m3Dplain in my tex directory.
Its a beautifully done book, so I am excited to learn some of the tricks Corral uses.
Monday, July 6, 2009
Hearing a trigonometric identity
If you force a harmonic oscillator with natural frequency w_0 with a sinusoidal force of frequency w, the resulting steady-state is a linear combination of those two frequencies. If its something in the audible range, you hear either the two seperate frequencies or one frequency with a beat if they are close together. In other words, you hear either the right or left hand side of the identity shown below.
Sage source code available here. Ironically, because of my use of html I can't seem to show the source directly here.
Subscribe to:
Posts (Atom)