skip to main |
skip to sidebar
 An image map of the human mitochondrion, linked to its GenBank entry by region, showing the G+C content in a small window. Created in Sage using the biopython optional module and this source code.
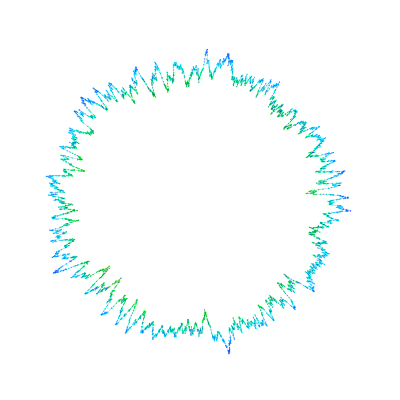
 All 99 (complex) solutions of the Albouy-Chenciner equations for central configurations of the Newtonian three-body problem, with equal masses. There are three "distances" for each solution; each set of distances are drawn as a triangle. The unit circle is included for a sense of scale. The solutions of primary interest are real, but understanding the complex solutions is important for analyzing these equations.
This was computed with Sage, with the bulk of the work was done with Jan Verschelde's PHCpack. At the moment, PHCpack is in sage as an optional package, so you would have to install that to get the code to work: source code.
 Light reflecting in four tangent spheres....this relates to a math problem I abandoned a few years ago, maybe I'll work on it again someday. The sage code for the above:
t = Tachyon(camera_center=(0,-4,1), xres = 1200, yres = 800, raydepth = 12, aspectratio=.75, antialiasing = True)
t.light((0.02,0.012,0.001), 0.01, (1,0,0))
t.light((0,0,10), 0.01, (0,0,1))
t.texture('s', color = (.8,1,1), opacity = .9, specular = .95, diffuse = .3, ambient = 0.05)
t.texture('p', color = (0,0,1), opacity = 1, specular = .2)
t.sphere((-1,-.57735,-0.7071),1,'s')
t.sphere((1,-.57735,-0.7071),1,'s')
t.sphere((0,1.15465,-0.7071),1,'s')
t.sphere((0,0,0.9259),1,'s')
t.plane((0,0,-1.9259),(0,0,1),'p')
t.show()
 This is mostly a test of how code looks in a post. The sage functions below are some initial attempts to write basic dynamical systems plotting functions for educational purposes.
def cobweb(a_function, start, mask = 0, iterations = 20, xmin = 0, xmax = 1):
'''
Returns a graphics object of a plot of the function and a cobweb trajectory starting from the value start.
INPUT:
a_function: a function of one variable
start: the starting value of the iteration
mask: (optional) the number of initial iterates to ignore
iterations: (optional) the number of iterations to draw, following the masked iterations
xmin: (optional) the lower end of the plotted interval
xmax: (optional) the upper end of the plotted interval
EXAMPLES:
sage: f = lambda x: 3.9*x*(1-x)
sage: show(cobweb(f,.01,iterations=200), xmin = 0, xmax = 1, ymin=0)
Note: This is very slow with symbolic functions.
'''
basic_plot = plot(a_function, xmin = xmin, xmax = xmax)
id_plot = plot(lambda x: x, xmin = xmin, xmax = xmax)
iter_list = []
current = start
for i in range(mask):
current = a_function(current)
for i in range(iterations):
iter_list.append([current,a_function(current)])
current = a_function(current)
iter_list.append([current,current])
cobweb = line(iter_list)
return basic_plot + id_plot + cobweb
def orbit_diagram(a_function,parameter_interval, domain=[0,1], mask = 50, iterations = 200, param_num = 500.0):
'''
Returns a plot of the iterations of a function as a function of a parameter value.
INPUT:
a_function: a function of one variable
parameter_interval: a two-element list of the lowest and highest parameters to plot.
domain: (optional) a two-element list of the lowest and highest input values to iterate
mask: (optional) the number of initial iterates to ignore
iterations: (optional) the number of iterations to draw, following the masked iterations
EXAMPLES:
sage: f = lambda x,m: m*x*(1-x)
sage: show(orbit_diagram(f,[3.4,4], mask = 100, iterations = 500), xmin=3.4, ymin=0)
NOTES:
This is pretty crude so far.
'''
point_list = []
plen = RDF(parameter_interval[1] - parameter_interval[0])
seed = random()*(domain[1]-domain[0])+domain[0]
for i in srange(parameter_interval[0],parameter_interval[1],plen/param_num):
for x in range(mask):
seed = a_function(seed,i)
for x in srange(iterations):
seed = a_function(seed,i)
point_list.append((i,seed))
return point(point_list,pointsize=1,rgbcolor=(0,0,0))
I've always hated the word 'blog', which I think is the only reason I haven't started one until now. But now with the sage projects new blog, I guess I'll give it a try.
 All 99 (complex) solutions of the Albouy-Chenciner equations for central configurations of the Newtonian three-body problem, with equal masses. There are three "distances" for each solution; each set of distances are drawn as a triangle. The unit circle is included for a sense of scale. The solutions of primary interest are real, but understanding the complex solutions is important for analyzing these equations.
 Light reflecting in four tangent spheres....this relates to a math problem I abandoned a few years ago, maybe I'll work on it again someday. The sage code for the above: